
Documentation
Neurotransmitter Cycling Model Diagram
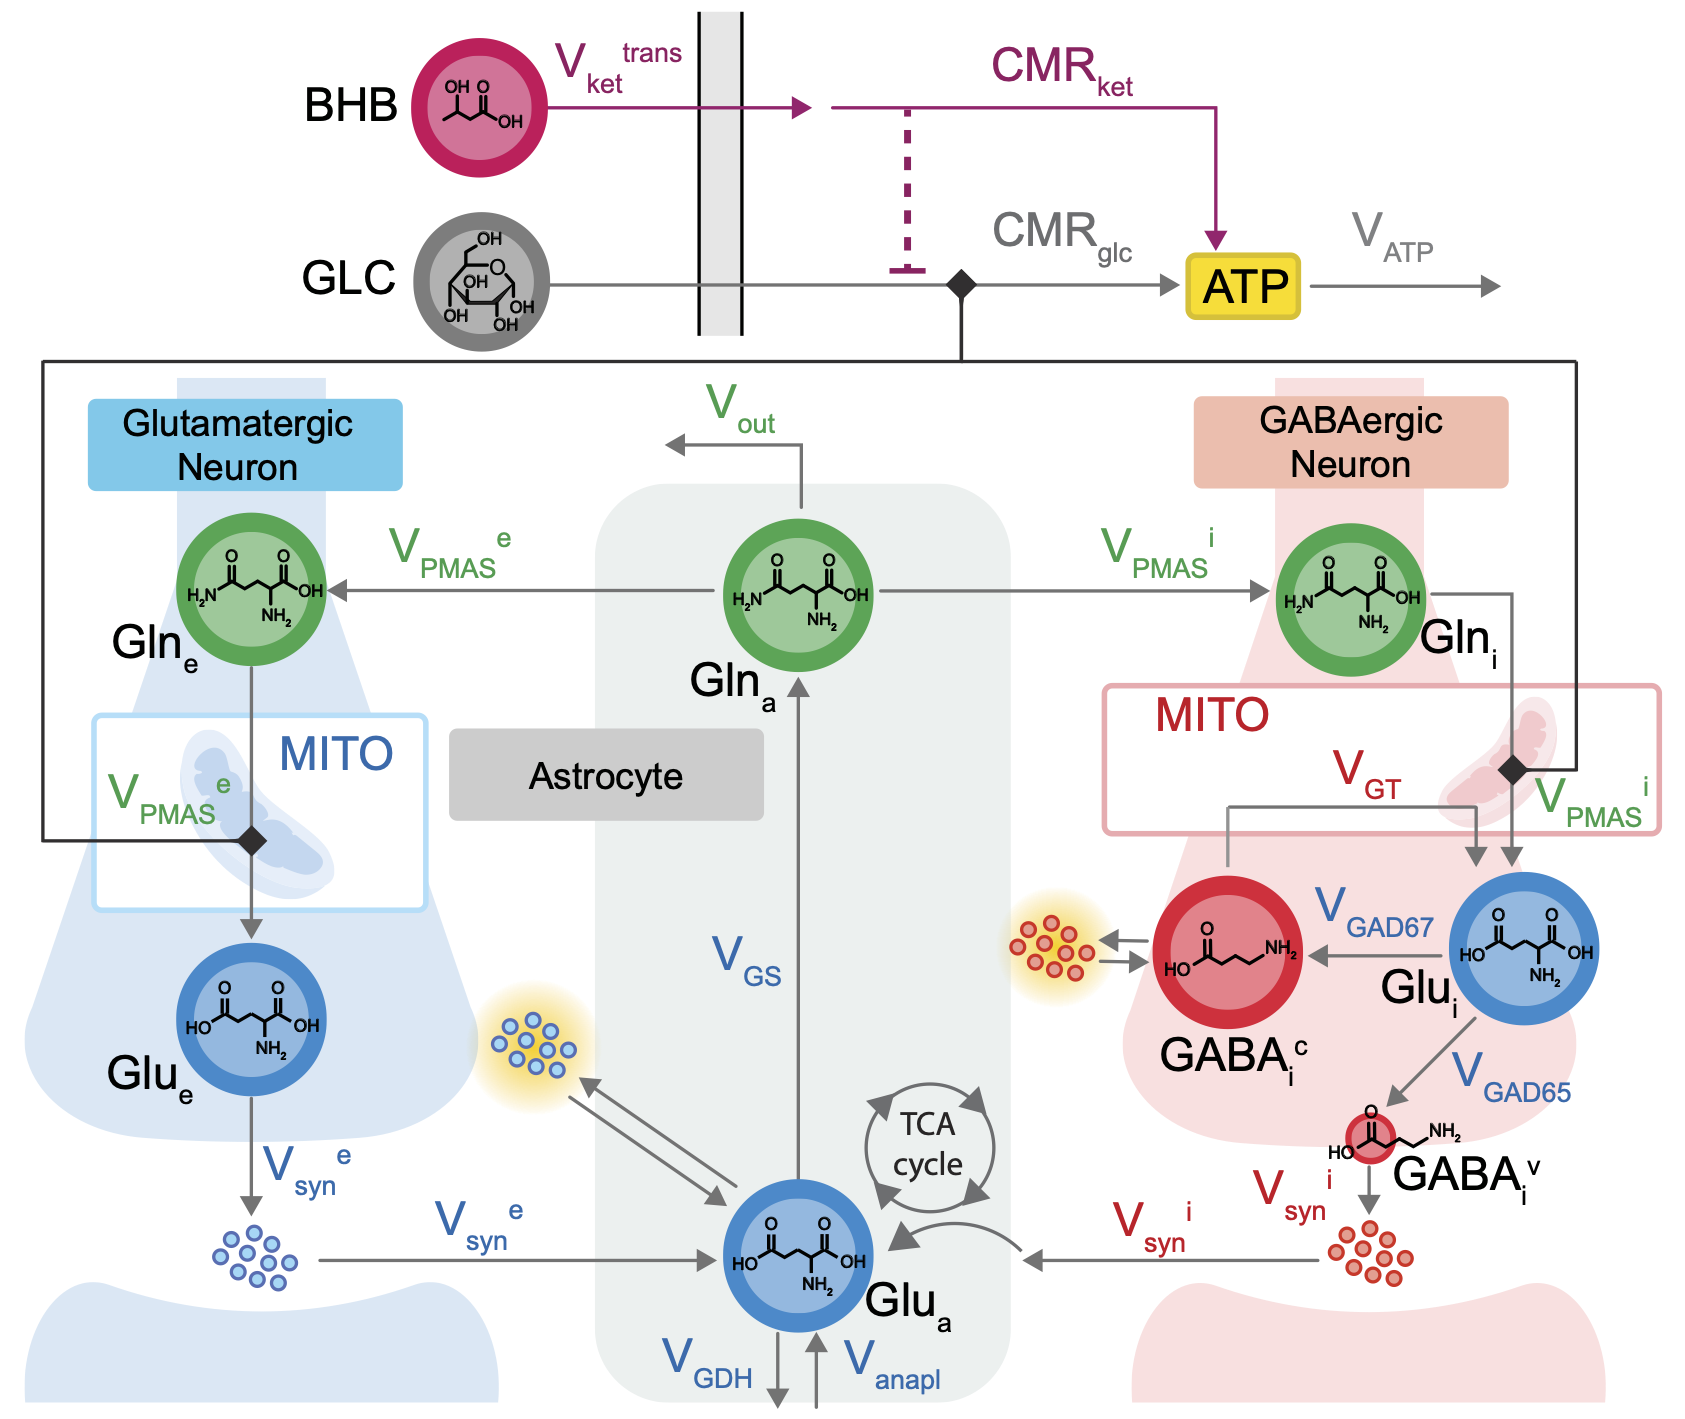
The diagram shows the reaction network including transport, utilization, and cycling of neurotransmitters between excitatory neurons, inhibitory neurons, and astrocytes.
What is this model for?
This model simulates brain neurotransmitter levels in the brain, focusing on glutamate and gamma-aminobutyric acid (GABA). Use this tool to test how specific conditions or interventions affect metabolic and vesicular Glu/GABA levels.
Mechanism
MRS and traditional neurochemical studies have demonstrated a linear relationship between the synthesis rates of the neurotransmitters glutamate and GABA and neuronal glucose metabolism (Sibson et al. 1998, Rothman et al. 2022). This relationship is mechanistically grounded in the pseudo malate-aspartate shuttle model (PMAS) (Rothman et al. 2024). According to this model, glutamate synthesis from glutamine in neurons is directly coupled to glucose oxidation via the malate-aspartate shuttle.
Building upon the PMAS, we developed a computational model that simulates how perturbations in metabolism impact the dynamics of neurotransmitter cycling in the brain.
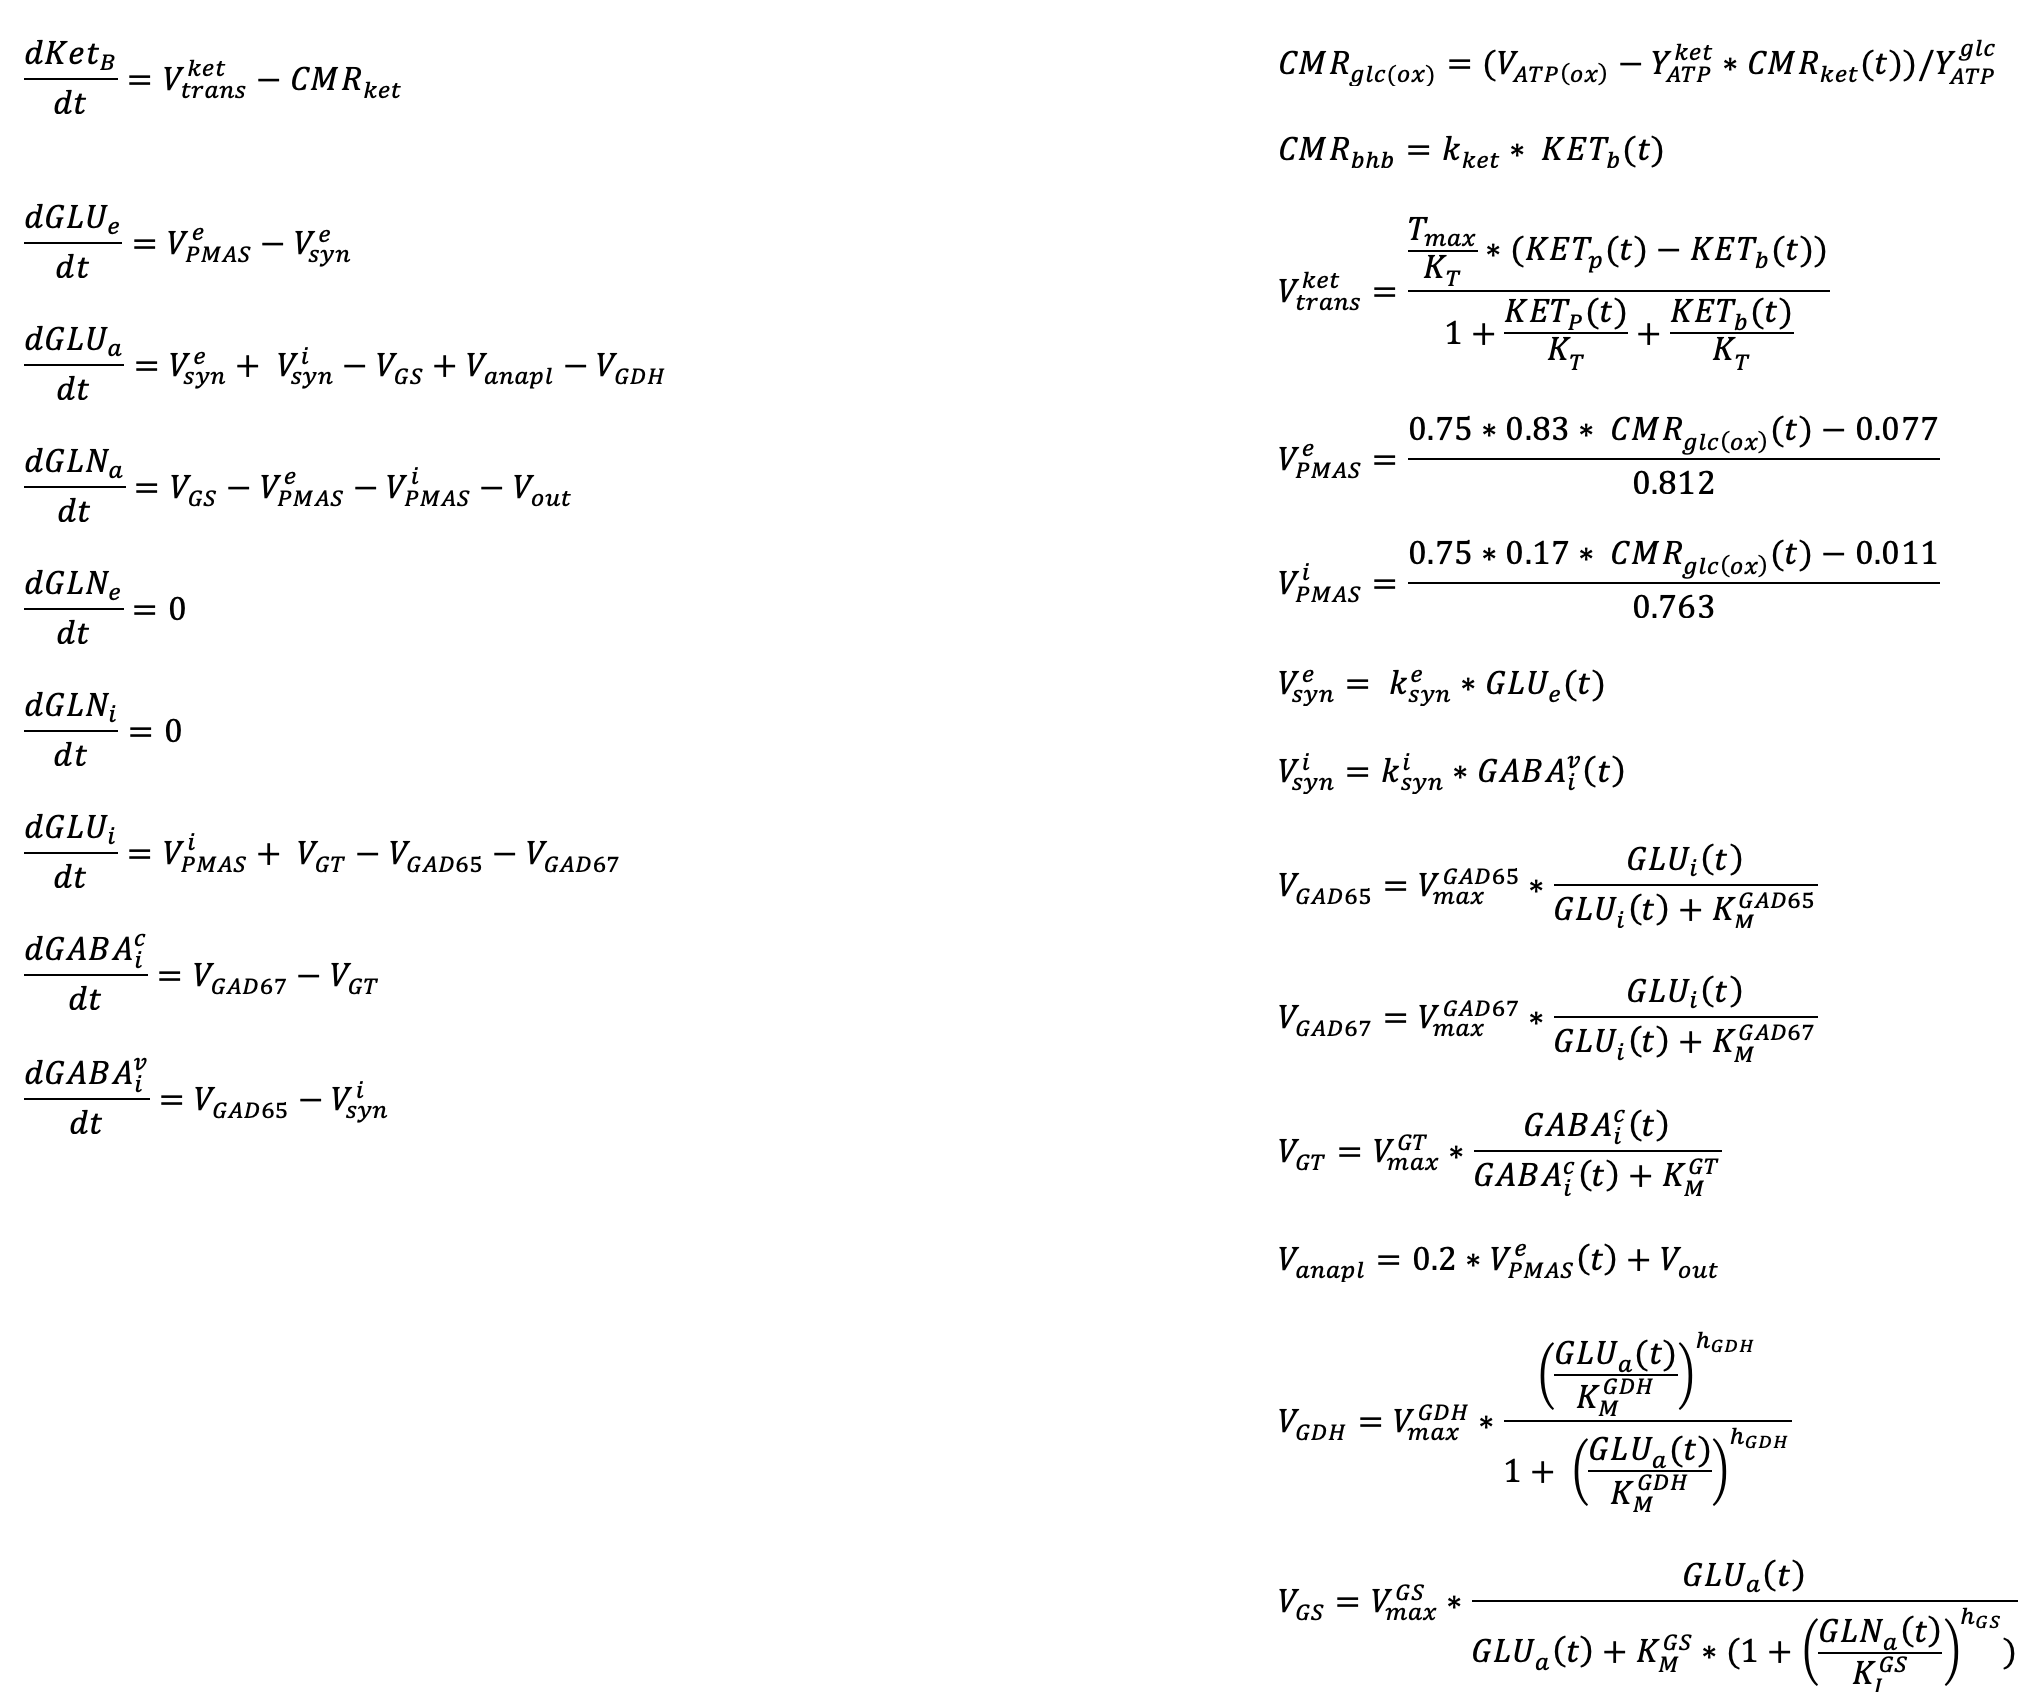
The dynamics of neurotransmitter cycling were simulated using differential equations representing reactions within a connected system of excitatory neurons, inhibitory neurons, and astrocytes. Key reaction pathways involved in neurotransmitter cycling were identified via mass balance analysis (Rothman et al. 2024) and the principle of metabolic control (Fell 1992), while reactions exerting minimal control over system dynamics were modeled as simple flow-throughs. Reaction equations were parameterized from literature and enzyme database entries.
See the corresponding publication for more details and the underlying equations here: Link to be added.
The model code and relevant tutorials are available here: GitHub
References
How to Use This Tool
- ● The Model tab displays the reactions and their reactants, with the equations for the reaction rates shown below.
- ● Adjust reaction parameters to test your hypotheses by selecting parameters from the dropdown menu in the Parameters tab and entering their values. You can simultaneously modify as many parameters as you wish.
- ● You can simulate two conditions (Condition 1 and Condition 2) simultaneously to facilitate easy comparison between a test and a reference condition. You can modify the parameters of either condition by selecting it using the toggle switch.
- ● Under the Initial Conditions tab, you can modify the starting concentrations of your simulations.
- ● The model will automatically simulate using the updated values.
- ● To restore default parameters, click the Reset Settings button.
- ● To display all adjustable parameters, click the Full Model button.
- ● Define your own simulation length. Use this option to ensure the simulation runs long enough to reach a new steady state.
- ● There are two options for displaying the results. Dynamics shows the time series for the full simulation, while End-points displays only the final concentrations as bar plots.
- ● Select the variables you want to plot, and the graphs will update accordingly.
- ● Enable Percentage Change to visualize relative changes compared to initial values instead of absolute concentrations.
- ● To download a plot, hover over it with your cursor to access the Download plot as a PNG option.
- ● To download the simulation results as an Excel file, click the Download Results button within the Dynamics tab.
Abbreviations & Legend
Metabolites
GLC: glucose
KET: ketone (beta-hydroxybutyrate)
GLN: glutamine
GLU: glutamate
GABA: gamma-aminobutyric acid
ATP: adenosine triphosphate
Kinetic Parameters
Vmax: maximum reaction rate
Tmax: maximum transport rate
Km: Michaelis-Menten constant
KI: Michaelis-Menten constant for inhibition
KT: Michaelis-Menten constant for transport
CMR: cerebral metabolic rate
Enzymes & Processes
PMAS: pseudo malate aspartate shuttle
PAG: phosphate-activated glutaminase
GS: glutamine synthetase
GDH: glutamate dehydrogenase
GT: GABA transaminase
GAD: glutamate decarboxylase
anapl: anaplerosis
Sub- and Superscript Notation
_e: excitatory neuronal
_i: inhibitory neuronal
_a: astrocytic
_v: vesicular
_c: cytosolic
_b: brain
_p: plasma
_syn: synaptic
_trans: transport
_out: efflux